2024-08-02
A minor release resulted in a cascade of errors that perturbed platform stability and customer service. How it went wrong,what we’ve learnt
On Friday, August 2nd, 2024 Clever Cloud’s platform became unstable, leading to downtime of varying duration and scope, for many customers. The impact was both on the API itself, and on some services running as add-ons or runtimes.
These events occurred because:
- A planned minor maintenance of the Messaging component has locked the cluster causing an incident (www.clevercloudstatus.com/incident/880) between 2:00 PM CEST and 2:29 PM CEST
- As an indirect consequence, the infrastructure experienced I/O and memory pressure between 3:40 PM CEST and 4:16 PM CEST causing some hypervisors to crash.
Impacts were observed for customers relying on the EU-FR-1 (PAR) region, and remote zones depending on the EU-FR-1 control plane (OVHcloud, Scaleway, and Oracle). Privates and on-premise zones weren’t impacted.
| Product | Impact |
|---|---|
| Runtimes | Customers with applications running on impacted hypervisors may have seen performance degradation. Customers applications traffic served through impacted load balancers also may have suffered from traffic issues. |
| Runtimes deployment | Deployment API was unreachable during the incident, leading to new deployment or upscale/downscale operations not to succeed. |
| Databases (MySQL, PostgreSQL, Redis, MongoDB) | Customers with databases running on impacted hypervisors may have seen performance degradation or even unavailability. No data has been lost during the incident. |
| Cluster services (Elastic, Couchbase, Cassandra, …) | Depending on both infrastructure pressure and the running technology, some nodes may have survived the incident, hence the provided service may have been fulfilled. We know for sure, some clusters had issues during the incident, others didn’t. |
| VPN / IPSec | Most of the VPN endpoints were unavailable during the incident. |
| Observability | The service has been unavailable but no data has been lost. |
Timeline
| Timeline | Component | Description |
|---|---|---|
| 2024-08-02 10:06 CEST | Messaging | Clever Cloud data team starts a minor rolling maintenance upgrade of the Apache Pulsar component to release 3.3.1. This maintenance also enables a new balancer algorithm for bundles placement optimization. |
| 10:08 CEST | Messaging | Monitoring shows connection issues to the messaging platform. |
| 10:09 CEST | Messaging | Engineers confirm connections issues to produce data into the event bus. |
| 10:10 CEST | Messaging | Messaging issues impact agents on hypervisors, log forwarders from load balancers and deployments — Impact starts — |
| 10:11 CEST | Messaging | Monitoring graphs show the backlog ramping up and no new producers / consumers to succeed. (backlog means consumption isn’t streamlined with production). |
| 10:13 CEST | Messaging | Monitoring starts to show a recovery state - reads happening again - Cluster convergence. |
| 10:18 CEST | Messaging | Monitoring shows no writes anymore. Backlogs are stalled and no reads from the event bus. |
| 10:20 CEST | Messaging | The cluster is considered defective. |
| 10:58 CEST | Messaging | Engineering team understands that the new parameter is conflicting in a transparent rolling upgrade. They're rolling back the parameters. |
| 11:10 CEST | Deployments | Customers can no longer deploy their application |
| 11:36 CEST | Messaging | Messaging Brokers fail to restart. A conflictual metadata blocks the reload. Engineering team shuts down client proxies to release brokers. |
| 11:36 CEST | Messaging | Monitoring shows "Lookup request" queue is full on all brokers (50k pending requests). |
| 11:46 CEST | Messaging | An unassigned topic fails to load (unloaded state prevents it to be manipulated from admin commands, like deletion). |
| 11:48 CEST | Deployments | Engineering team behind deployments looks for a countermeasure to overcome messaging issues. |
| 11:50 CEST | Deployments | As a workaround, they enable notification events to switch on RabbitMQ. |
| 12:22 CEST | Messaging | All brokers have been shut down. Incriminated topics are successfully loaded and deleted. All brokers are now being started progressively. |
| 12:28 CEST | Messaging | All brokers have been started. |
| 12:30 CEST | Infrastructure | Lots of hypervisors have their CPU load drastically increase. Almost all hypervisors of all regions are impacted. Some hypervisors are more impacted than others. |
| 12:31 CEST | Deployments | The Deployments workaround is running successfully. Deployments are ok in theory, but fails to find enough resources to consume the queues. |
| 12:35 CEST | Deployments | Load balancers can't sync with Deployments API due to Messaging issues. This leads to unsynced load balancers configuration for moving applications deployments (scale up/down, new deployments, etc.). |
| 12:35 CEST | Infrastructure | Monitoring alerts "HV Agent has too many tasks" start to raise. From this point, multiple hypervisors may randomly kill VM management processes. |
| 12:36 CEST | Load Balancers | Some load balancers are among VM killed and watchdog monitoring components reload every impacted service exposed through the load Balancers. |
| 12:38 CEST | Core APIs | The main API components crashed due to out-of-memory (OOM) errors. |
| 12:39 CEST | Infrastructure | Watchdog is being stopped to prevent it from reloading all failed components. Engineers prefer to understand what's happening and start components one by one. |
| 12:42 CEST | Network | Some private networks are flapping, some services like the observability platform become unavailable for a couple of minutes. |
| 12:47 CEST | Infrastructure | Hypervisor (1) reboot (kernel panic - hung VM tasks on interacting with KVM API). |
| 12:48 CEST | Infrastructure | Hypervisors (3) reboot (kernel panic - hung VM tasks on interacting with KVM API or ext4 filesystem). |
| 12:50 CEST | Observability | Metrics API ingestion is disabled to preserve the underlying storage cluster. Buffering ensures ingestion availability. |
| 12:51 CEST | Infrastructure | Hypervisor (1) reboot (kernel panic - hung VM tasks on writing to ext4 disks). |
| 12:54 CEST | Messaging | Messaging proxies are restarted. Connections are recovering and production / consumption of messages is ok. — Messaging OK — |
| 13:05 CEST | Load Balancers | The Clever Cloud API is down and the admin tools as well. |
| 13:10 CEST | Core APIs | Main API starts to consume events from the workaround queue. |
| 13:30 CEST | Infrastructure | Clever Cloud engineers identify too many CPU load on hypervisors caused mostly by small VMs (pico/nano) |
| 13:30 CEST | Observability | Few cluster critical nodes are not reachable, reporting "the database may have data loss and availability loss", it is in a locked state. Engineers decided to shut down the whole cluster for proper restart later. |
| 13:35 CEST | Observability | A global maintenance is set on all monitoring instances on all regions to avoid them sending too many monitoring events and overloading orchestrator actions. No more monitoring actions are sent (upscale, downscale, unreachable, disk, etc.). |
| 13:35 CEST | Infrastructure | Clever Cloud engineers notice too many disk reads on hypervisors, mostly small VMs (pico/nano). They think it might be related to Vector not being able to push VMs logs to pulsar, triggering small VMs to SWAP |
| 13:44 CEST | Core APIs | The Clever Cloud API is reading and acknowledging events from deployments from 100k at 12:50 CEST to 8.5K |
| 13:49 CEST | Core APIs | The Clever Cloud API has finished processing deployment events. |
| 13:50 CEST | Infrastructure | Some hypervisors (12) are flagged to drain some workload out |
| 13:50 CEST | Load Balancers | Shutdown is performed on some load balancers to free CPU and memory usage as there are others instances that still need resources. |
| 14:00 CEST | Core APIs | Core services are being recovered and deployments are being reloaded. This will synchronize back load balancers for customer's applications trying to reach their new deployments. |
| 14:08 CEST | Core APIs | Some zombies VM are being cleaned to accelerate the recovery process. |
| 14:38 CEST | Load Balancers | We have gathered information from load balancers configurations to verify the VM states of the back office admin interface. |
| 14:39 CEST | Core APIs | Critical core services are OK. Deployments are being rolled out. |
| 14:50 CEST | Core APIs | Admin interface has been moderated instead of stopped by human error. Quickly fixed. |
| 15:03 CEST | Load Balancers | The back office admin interface is up and running. |
| 15:07 CEST | Deployments | Orchestrator instruction queues still have difficulties to be processed. We keep receiving a lot of Monitoring actions even while the monitoring instances are in maintenance mode. |
| 15:40 CEST | Infrastructure | Hypervisors have experienced reboots around 12:48 CEST. Recovery process is occurring and will take a couple of minutes. |
| 15:45 CEST | Observability | We clear the monitoring instance alert queue to drop monitoring events that were still queued to avoid flooding the orchestrator instructions. |
| 15:56 CEST | Core APIs | Some private Wireguard networking meshes seem still experiencing network issues. |
| 16:00 CEST | Deployments | We observe that some ochestrator actions are taking multiple seconds (+30s in some cases), slowing down the orchestration operations. |
| 16:05 CEST | Deployments | A RabbitMQ node is on an overloaded hypervisor and is thus overloaded too. It slows down the cluster used by orchestrator. |
| 16:05 CEST | Infrastructure | Infrastructure engineers delivered new hypervisors on the EU-FR-1 region that were drained then parked for upgrade, to add capacity to help other overloaded hypervisors. |
| 16:15 CEST | Deployments | A RabbitMQ node is removed from the cluster because the node is overloaded and disturbs the orchestration. orchestrator is now correctly working. |
| 16:16 CEST | Core APIs | Customer applications are being deployed to scale up deployments. |
| 16:19 CEST | Load Balancers | One ADC has kernel panic and it is unable to boot. |
| 16:19 CEST | Load Balancers | Admin ADCs are running and the configuration is synchronized. A rule is removed on load balancers to prevent customers from deploying through the console. |
| 16:24 CEST | Core APIs | In the meantime, we continue to identify noisy VMs that have been impacted by the Pulsar outage. |
| 16:33 CEST | Observability | Attempt to restart the Metrics API - Wireguard mesh networking issue encountered due to stale conntrack. |
| 17:05 CEST | Infrastructure | Previously flagged HV are back to schedule Runtimes VM. |
| 17:06 CEST | Load Balancers | Previously shut ADC are now up and running. |
| 17:06 CEST | Load Balancers | Every regional L7LB has been rolling restarted. |
| 17:07 CEST | Load Balancers | Begin the rolling restart of every L4 load balancers. |
| 17:14 CEST | Deployments | Some load balancer virtual machine are still unreachable, The HV agent is restarted and the load balancer as well. |
| 17:28 CEST | Observability | The FoundationDB cluster powering the Metrics API is now healthy. |
| 17:30 CEST | Load Balancers | Every L4LB has been rolling restarted. |
| 17:30 CEST | Load Balancers | Every dedicated L7LB has been rolling restarted. |
| 17:32 CEST | Observability | Metrics API directories are started and warms up. |
| 17:33 CEST | Load Balancers | Some customers endpoints may be not responsive, engineering and support teams up to investigate. |
| 17:49 CEST | Load Balancers | These endpoints are now back online. |
| 18:00 CEST | Observability | Cleanup of EU-FR-1 region Monitoring instance duplicate hosts. |
| 18:13 CEST | Observability | Monitoring PAR6 AZ back in production and sending monitoring events. |
| 18:19 CEST | Observability | Monitoring PAR7 AZ back in production and sending monitoring events. |
| 18:20 CEST | Core APIs | All deployments are now being rolled out. — Deployments ok — |
| 18:22 CEST | Load Balancers | Access logs productions is ok, processing pipeline is starting. |
| 18:24 CEST | Observability | Monitoring PAR8 AZ back in production and sending monitoring events. |
| 18:30 CEST | Infrastructure | Still a few hundreds of VMs are consuming very high CPU rates and being cleaned. |
| 18:30 CEST | Customers | We ensure premium customers not having applications without VMs instances. |
| 18:35 CEST | Core APIs | We estimate approximately 1h30 to have fully recovered all deployment of applications. |
| 18:36 CEST | Infrastructure | All Hypervisors have recovered to a nominal load |
| 18:36 CEST | Observability | Maintenance is removed on Monitoring, we start receiving oncall alerts again. |
| 18:39 CEST | Customers | We ensure non-premium customers not having applications without VMs instance. |
| 18:40 CEST | Deployments | We restart all HV agents on the infrastructure as it suspects communication errors between agents on hypervisors and control plane. |
| 18:40 CEST | Core APIs | We restart add-ons providers apis which seem to be unable to communicate with the control plane event bus. |
| 18:53 CEST | Deployments | All dangling virtual machines in stopping state have been destroyed and application are deploying. |
| 19:05 CEST | VPN - IPSec | All IPSec links should be back online. |
| 20:45 CEST | Observability | Metrics API directories are ready to serve. |
| 20:50 CEST | Observability | Metrics API queries are enabled. |
| 20:50 CEST | Observability | Telemetry confirmed that we are processing access logs |
| 20:51 CEST | Observability | Metrics API ingest is enabled with a ramp up QoS policy. |
| 22:53 CEST | Observability | Metrics API ingestion policy is disabled, the cluster is fully functional. |
| 22:53 CEST | All impacts resolved — IMPACT END — |
Analysis
Messaging Maintenance (Apache Pulsar)
Apache Pulsar is used as the fundamental layer of messaging. This component has interesting multi-tenancy capabilities and supports very high cardinality of namespace/topics creation. It’s not exempt of bugs, and it regularly receives a fair amount of bug fixes. Minor releases are applied as a rolling upgrade basis. When it happens, topics are handed over from a broker to another. Since the architecture of Apache Pulsar has strong separation between the messaging layer and the storage layer, brokers are stateless and the topic handover is a seamless operation that doesn’t affect connected clients. They will receive a notice that the topic has moved to another broker, and connect to the new one. This is an expected behavior implemented by clients and constantly happening for broker load management, resizing, etc. In our topology, there are additional proxies between customers’ clients and brokers, so only proxies are seeing this administrative rebalancing.
In this minor maintenance, we opt in for an optimized balancer named TransferShedder instead of the native OverloadShedder.
loadManagerClassName=org.apache.pulsar.broker.loadbalance.extensions.ExtensibleLoadManagerImplloadBalancerLoadSheddingStrategy=org.apache.pulsar.broker.loadbalance.extensions.scheduler.TransferShedderPulsar scalability is performed through the concept of bundles which are kind of scalability groups to perform administrative tasks. This change also implies moving from the modular bundle unloading strategy to the extensible one. These changes bring many improvements by removing storage on the metadata layer, and having a pre-assignation for the next broker when unloading a topic which shortens the switch from a broker to another.
This new extensible unload strategy relies on non-persistent real time replication among brokers. Which means when a first broker is upgraded, it initializes the system topic to synchronize other brokers with load metadata. Unfortunately, the extension failed to initialize properly, and doesn’t create the system topic, but without crashing the broker which will be seen up by our monitoring :
2024-08-02T08:48:53,344+0000 [CompletableFutureDelayScheduler] WARN  org.apache.pulsar.broker.loadbalance.extensions.channel.ServiceUnitStateChannelImpl - clevercloud-pulsar-broker-c3-n1:8080 failed to wait for owner for serviceUnit:orga_79bb9459-98d7-48bb-91ea-cd64204d8140/logs/0x80000000_0xc0000000; Trying to return the current owner:Optional[clevercloud-pulsar-broker-c3-n1:8443] java.util.concurrent TimeoutException: null
2024-08-02T08:48:53,344+0000 [CompletableFutureDelayScheduler] ERROR org.apache.pulsar.broker.loadbalance.extensions.channel.ServiceUnitStateChannelImpl - clevercloud-pulsar-broker-c3-n1:8080 failed to get active owner broker. serviceUnit:orga_79bb9459-98d7-48bb-91ea-cd64204d8140/logs/0x80000000_0xc0000000, state:Owned, owner:Optional[clevercloud-pulsar-broker-c3-n1:8443]
java.util.concurrent.CompletionException: java.lang.IllegalStateException: The new owner clevercloud-pulsar-broker-c3-n1:8443 is inactive. Caused by: java.lang.IllegalStateException: The new owner clevercloud-pulsar-broker-c3-n1:8443 is inactive.
Since the monitoring didn’t catch it, the broker was up so the rolling process continued. The more it started, the more they tried to reach the topic metadata, fulfilling the Lookup requests queue :
2024-08-02T08:49:12,448+0000 [pulsar-io-3-5] WARN  org.apache.pulsar.client.impl.MultiTopicsConsumerImpl - Failed to get partitions for topic to determine if new partitions are added
java.util.concurrent.CompletionException: org.apache.pulsar.client.api.PulsarClientException$TooManyRequestsException: {"errorMsg":"Failed due to too many pending lookup requests","reqId":1946266099531305237, "remote":"clevercloud-pulsar-broker-c3-n9/192.168.2.9:6650", "local":"/192.168.2.9:58654"} Caused by: org.apache.pulsar.client.api.PulsarClientException$TooManyRequestsException: {"errorMsg":"Failed due to too many pending lookup requests","reqId":1946266099531305237, "remote":"clevercloud-pulsar-broker-c3-n9/192.168.2.9:6650", "local":"/192.168.2.9:58654"}
Ultimately, the topic has never been properly created and brokers ended up in a state where no topics were loaded :
2024-08-02T09:16:23,828+0000 [pulsar-io-3-7] WARN  org.apache.pulsar.client.impl.BinaryProtoLookupService - [non-persistent://pulsar/system/loadbalancer-broker-load-data] failed to get Partitioned metadata : {"errorMsg":"Failed to get partition metadata","reqId":2658063197115238188, "remote":"clevercloud-pulsar-broker-c3-n1/192.168.2.1:6650", "local":"/192.168.2.1:34522"} org.apache.pulsar.client.api.PulsarClientException$BrokerMetadataException: {"errorMsg":"Failed to get partition metadata","reqId":2658063197115238188, "remote":"clevercloud-pulsar-broker-c3-n1/192.168.2.1:6650", "local":"/192.168.2.1:34522"}
2024-08-02T09:16:24,346+0000 [broker-client-shared-scheduled-executor-7-1] WARN  org.apache.pulsar.client.impl.PulsarClientImpl - [topic: non-persistent://pulsar/system/loadbalancer-broker-load-data] Could not get connection while getPartitionedTopicMetadata -- Will try again in 795 ms
2024-08-02T09:16:24,348+0000 [pulsar-io-3-15] ERROR org.apache.pulsar.broker.service.ServerCnx - non-persistent://pulsar/system/loadbalancer-broker-load-data [id: 0xa5782645, L:/192.168.2.1:6650 - R:/192.168.2.1:34522] [SR:192.168.2.1, state:Connected] Failed to get partition metadata java.util.concurrent.CompletionException: java.lang.IllegalStateException: The registry already closed.Caused by: java.lang.IllegalStateException: The registry already closed.
When we noticed the fall of the bandwidth on the platform, we understood that no topics were loaded, we rolled back the modification on the unload strategy but we decided to stick with the 3.3.1 release.
Switching back to the old policy is a quick move. Configuration revisions are versioned, and this one in particular was pretty simple, yet we faced a new problem. The new unload strategy created a system topic that was unloadable by brokers because of a metadata conflict. The topic wasn’t assigned to any brokers, and it was a showstopper to initialize: Brokers wouldn’t start… We ended up stopping all brokers to start only one, preventing metadata conflict between them, then it succeeded to load the topic, so that we could finally delete it, unlocking all brokers start process. After that, in less than 10 minutes, all brokers were back to a nominal situation so we started proxies.
It’s worth mentioning that for non minor releases, we use a simulation process that emulates a full environment where we inject changes. This validates upgrades and changes by observing the infrastructure behavior before going to production. This process wasn’t used for minor maintenance upgrades or (apparently) small changes in the configuration profile.
Hypervisor IO/CPU pressure
The unavailability of the Apache Pulsar messaging layer has led to the buffering of telemetry agents on the Virtual Machines (VMs) running on Hypervisors (Servers). Customers VMs embed an observability agent named Vector (https://vector.dev/) we chose for its ability to be very efficient and safe (being written in safe Rust). These agents started to buffer in memory while Messaging service endpoints weren’t available. Even if the format is rather efficient, for small VMs it reached a limit of memory which triggered a lot of memory pressure on the kernel. When it happens, the kernel tries to flush all possible memory, wipes all disk caches, and ultimately remove processes from memory to load them instruction per instruction from disk.
At this stage, this is generating a lot of IO disk pressure on the underlying hypervisor (we noticed ~25Gbps on disks). These small VMs are spreaded globally among our Availability Zones, so we ended up having an overloaded server infrastructure.
Clever Cloud also runs on top of Clever Cloud, which usually has many benefits. In this case, it turned out to be a chicken and egg situation : we needed the scheduler to perform some massive actions and comply with deployments, but the control plane was performing suboptimally and the infrastructure struggled to provide available resources.
Hypervisor crashes — Kernel Panics
A few minutes after the hypervisors got their load increased, we started to see kernel panics on some of our host hypervisors. Those kernel panics were triggered by the khungtaskd kernel thread. This watchdog thread, living inside the Linux kernel, is responsible for watching all tasks the kernel is handling. It iterates over all the tasks and checks all tasks in the TASK_UNINTERRUPTIBLE state.
The TASK_UNINTERRUPTIBLE state means that a task can’t be interrupted. This is the D state you can see in ps or htop. For example, you can get this state by reading or writing to the disk but there are also other syscalls that can put your process in this state.
If the task is in this state for too long (default is 120s), then khungtaskd dumps a trace of the task (which program caused it, its current callstack, ..) in the kernel ring buffer. In our case, we also chose to panic when we have programs in this state: it usually means the kernel either has a bug or something else is going wrong. This watchdog already helped us multiple times in the past to crash the host before it gets completely unreachable and unpredictable.
Some of our hypervisors had processes stuck in TASK_UNINTERRUPTIBLE for too long, for various reasons: writing to disk, KVM syscalls, .. An analysis of the source code ( https://elixir.bootlin.com/linux/v6.10.3/source/kernel/hung_task.c#L91 ) confirms our thoughts on the observed behavior.
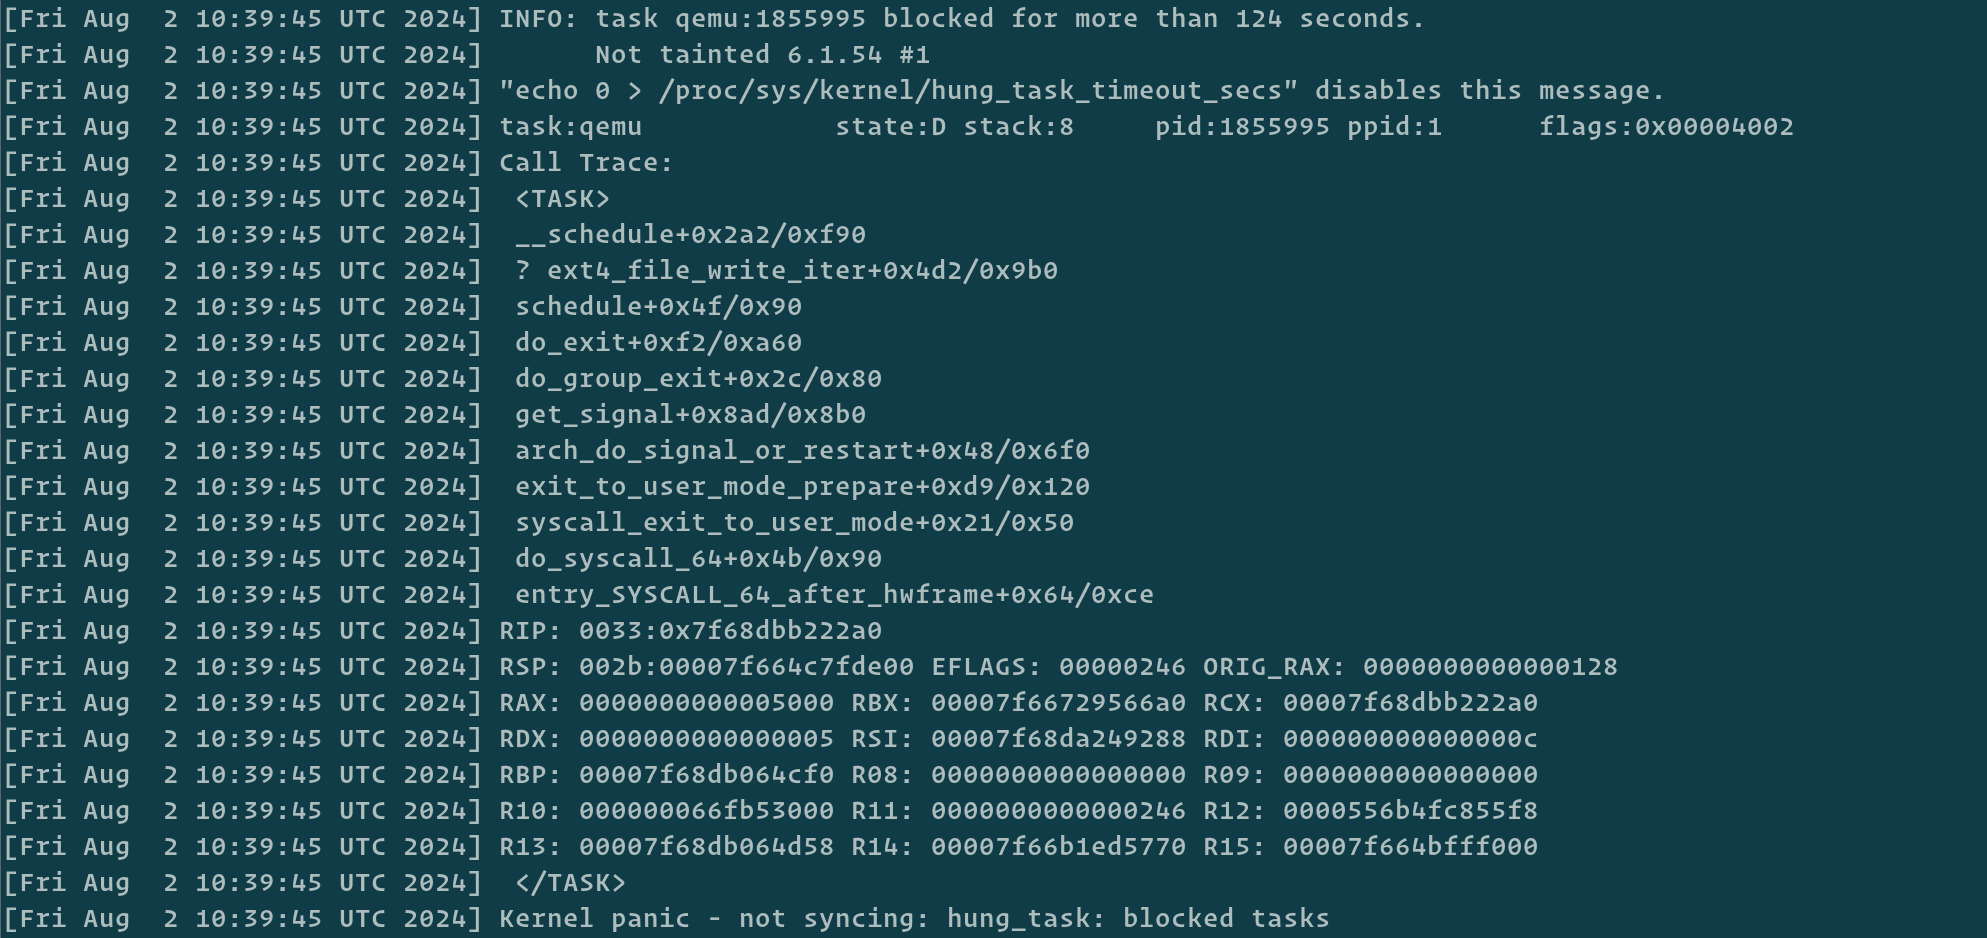
Stuck processes leading to a Kernel Panic
Monitoring down → upscale
During the event, the monitoring infrastructure triggered a lot of events for both infrastructure and customer services. We observed almost x3 deployments as usual during that day. Multiple reasons can explain this observation:
- The loss of hypervisors due to kernel panics made a lot of instances unreachable, leading to lots of deployments to honor the contract (e.g. number of minimum instances)
- VMs that were under memory pressure were usually unresponsive and so they were (correctly) seen as unreachable
- VMs that were on overloaded hypervisors might have also been slowed down due to the high CPU usage of the hypervisor. Those VMs had less CPU time to do their usual operations, making their load average increase. Our monitoring took that as an increase of CPU usage and they were ordered to upscale if they were configured to
- Some of our monitoring instances took more time to do their checks because they were overloaded as well. Because the monitoring data was missing due to late checks, it was interpreted as lack of data and so as unreachable VMs, triggering more Monitoring/Unreachable events
- Customers seeing their service unavailable are trying to trigger redeployment of their applications, which adds more scheduling tasks on the infrastructure
Our monitoring infrastructure, by observation of many key metrics (CPU Loads, CPU Steal, Availability, health checks, etc.) triggered a significantly higher rate of deployments, which at the time, wasn’t helping both to chill down the control plane already processing at the best it could and the overall infrastructure already overloaded.
Soothing the control plane
Once we understood some Virtual Machines (VMs) were inducing an abnormal high load on Hypervisors (HVs), we started to filter out machines that could help to free some resources. All non critical services have been shut down like the Observability platform: We stopped the Long Term Storage for Observability metrics data (our Warp10/FoundationDB cluster). Critical services benefit from In Memory Observability (Warp10 in memory standalones), so this was acceptable to preserve all available resources.
Overloaded VMs were collected, sorted and it appeared they shared a common pattern: they were small VMs with few memory resources. The reason has been covered a few lines above. The process after identifying them is obviously to kill them one by one by the SRE team. Nothing fancy here, but soon we started to regain control over all hypervisors.
Lessons & enhancements
We’ve learnt many lessons this Friday and we already identified many enhancements we will give to the platform. Sure this kind of incident occurring during a summer holiday period is tricky, but we escalated the problem quickly to call people on holiday as soon as 13:00 CEST. We identified two groups of enhancements. A first one, measurable, and identified as a key infrastructure management where some of the measurement are :
- Pulsar Broker health
- Pulsar Cluster health
- Hypervisor load
- Hypervisor I/O
- Hypervisor reboot (Kernel Panic)
- Zombies VM
- RabbitMQ Broker health
- RabbitMQ Cluster health
- Deployment queue consumption
These measurements give us KPIs to measure where we’ve been operationally good, and where we have lacked some visibility or reaction. We qualified them with four inputs:
- Time of event
- Time of detection
- Time of decision
- Time of resolution
This factual approach helped to challenge ourselves on established rules and showed we can improve or rethink some part of the infrastructure.
Other topics raised but without KPI analysis:
- Dealing with too many monitoring alerts
- Backup Bastion — a regional bastion is vulnerable
- Control Plane recovery process
- Correlation between monitoring and Orchestration
- Fault domain separation vs multi tenancy
- Rethink for runtime images and the role of the hypervisor
- Isolation for waved release upgrades (Pulsar)
All the above questions and KPIs convert to actionable actions for teams that you may question at any time.
Actions in progress
Following immediate actions, we created a lot of issues to avoid the same behavior in the future:
- Runtime image redesign / better hypervisor integration
- Regionalized observability for redundancy
- Better profiling for small VMs :
- Vector configuration
buffer.max_events/buffer.max_size(must be at least 256Mo iftype=disk)buffer.typememory(default) → switch todiskbuffer.when_fullblock(default) →drop_newest
- Journald verbosity and
SystemMaxUse - Cgroups restrictions for better process control
- I/O restrictions for VM manager
- Vector configuration
- Better zombies VM detection
We don’t face a lot of outages and big issues, because by design, we strive to do a good job of running production applications for our customers. As we grow, challenges grow, and we’re committed to achieve great production SLA because it’s our DNA, our mission: running your production workloads.
This experience will help us become even more reliable and we thank you for your help during this difficult time.
Did this documentation help you ?