Metrics
In addition to logs, you can have access to metrics to know how your application behaves. By default, system metrics like CPU and RAM use are available, as well as application-level metrics when available (apache or nginx status for instance).
Display metrics
For each application, there is a Metrics tab in the console.
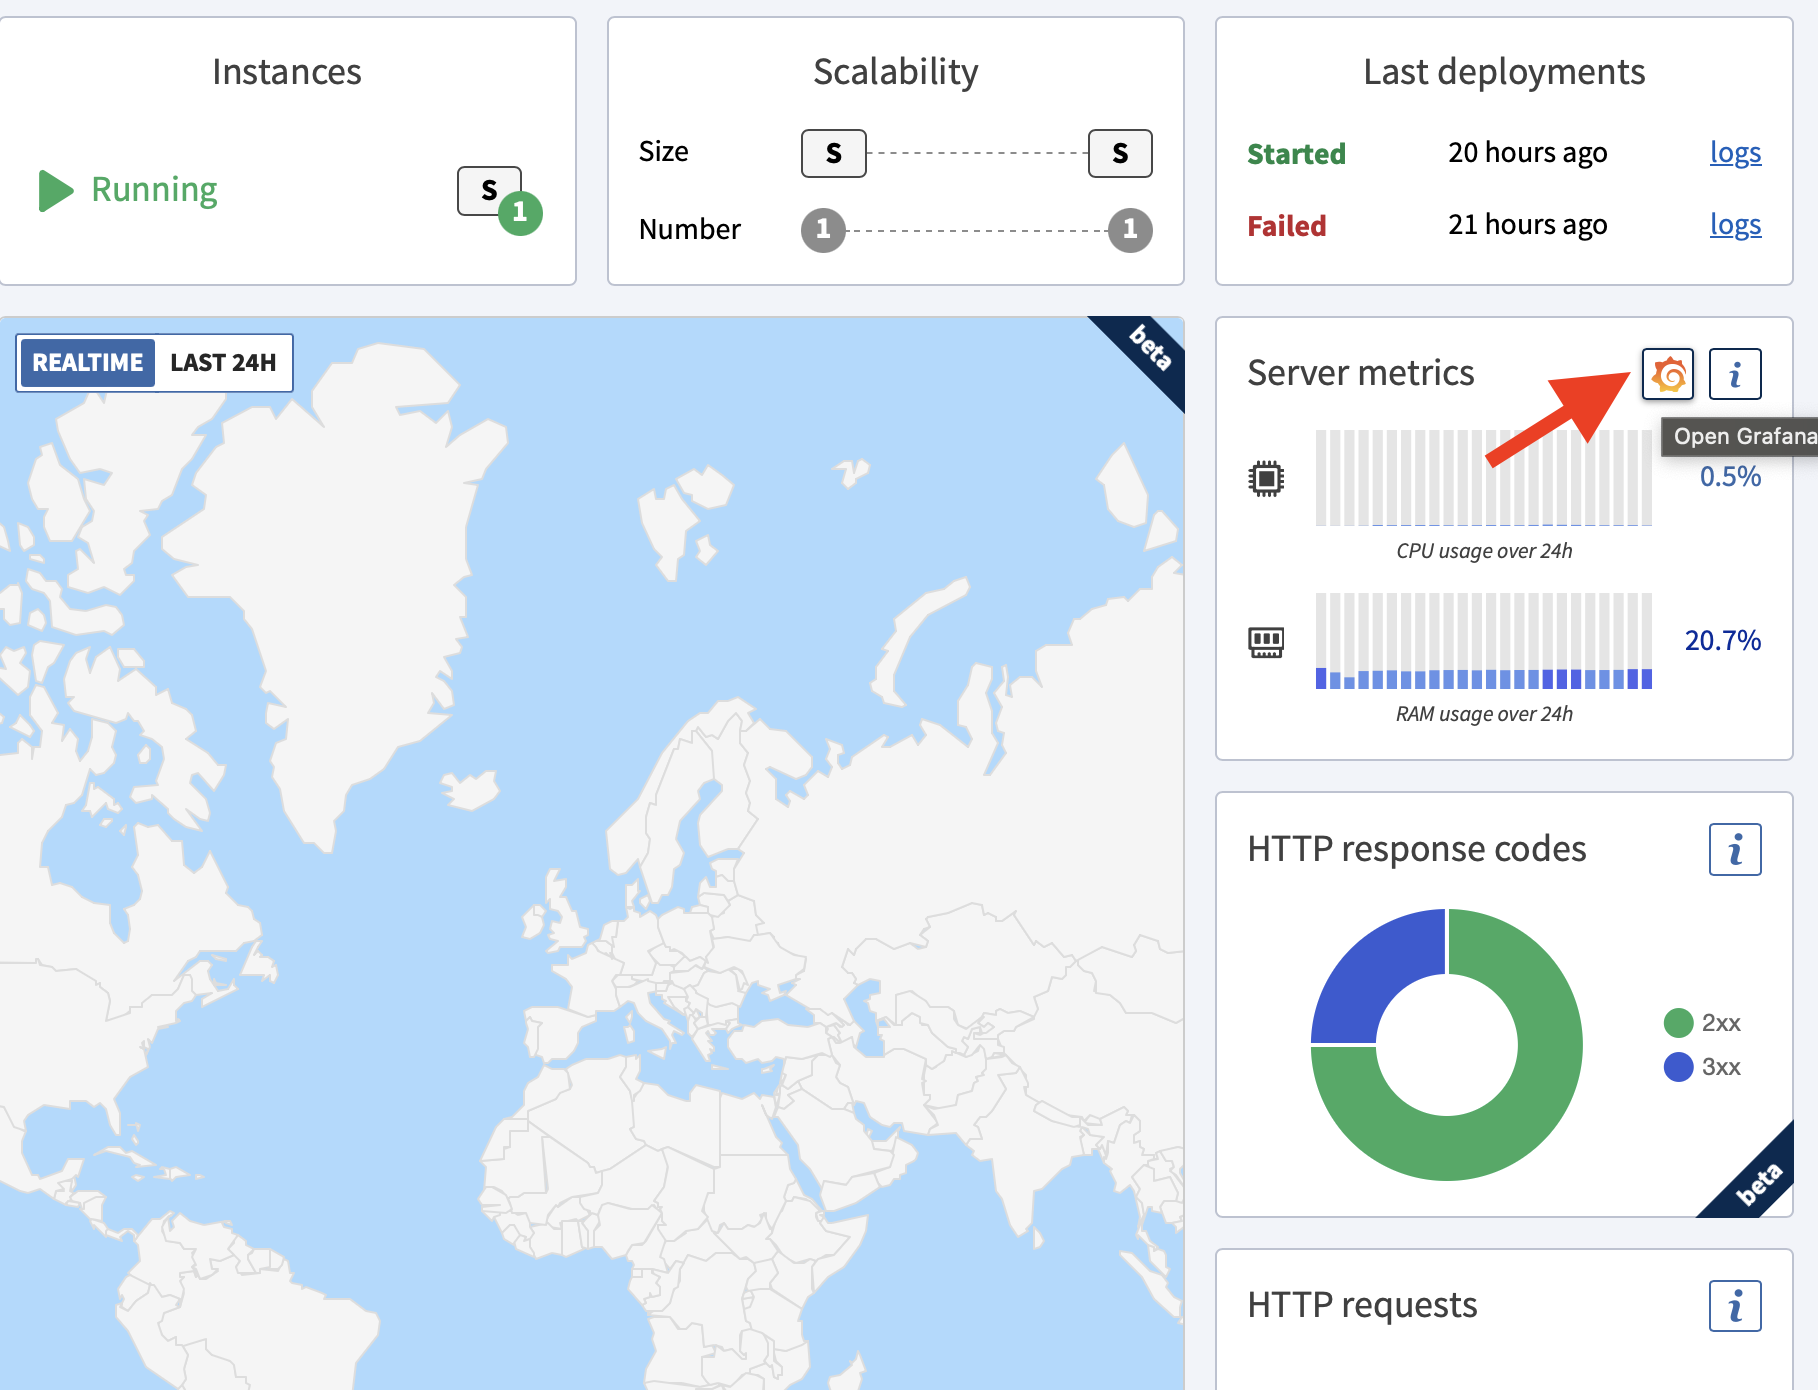
Overview pane
To get a quick overview of the current state of your scalers, the overview pane displays the current CPU, RAM, Disk and Network activity. On supported platforms, you can also have access to requests / second, and GC statistics.
Advanced pane
Advanced metrics allow you to access all gathered metrics, on a specified time range.
Custom queries
All metrics are stored in Warp 10, so you can explore data directly with the quantum interface, with WarpScript.
For instance, you can derive metrics over time, do custom aggregations or combine metrics.
Get alerts
You can set up alerts in Grafana to be notified on your apps and add-ons consumption. This can be useful to monitor databases capacity or latency.
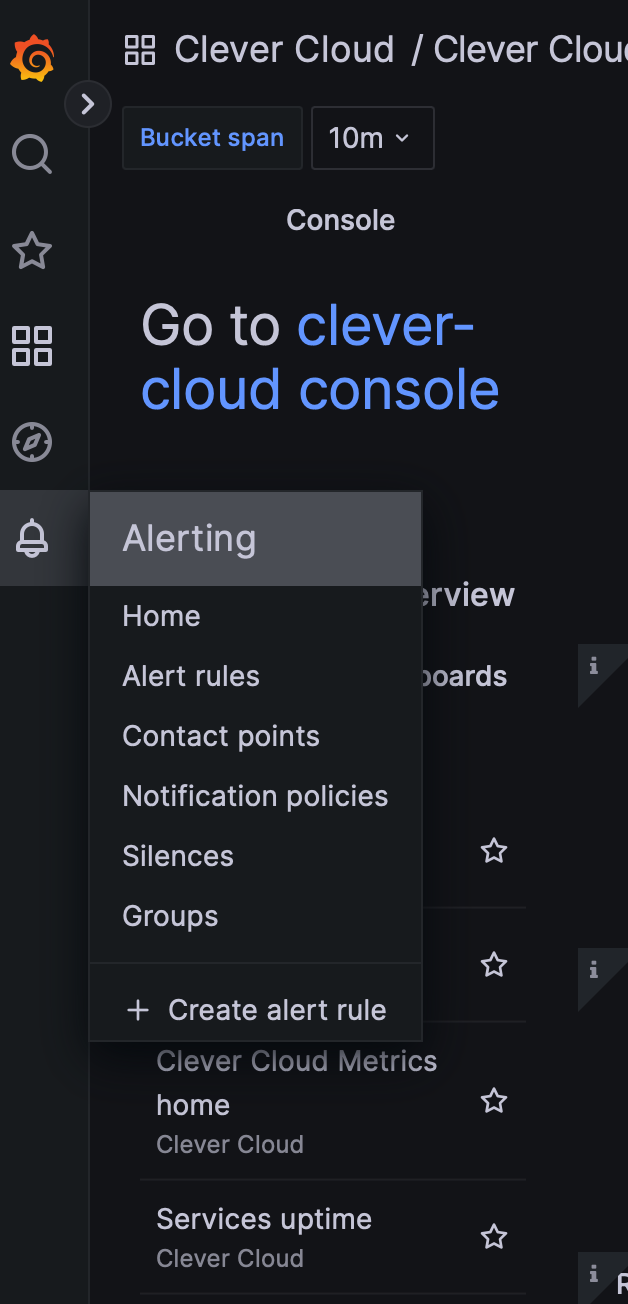
For example, check this tutorial on how to create Slack alerts with Grafana.
Access Logs metrics
All your applications access logs are pushed to Warp 10. You are now able to process them directly in the console in the Metrics tab of your applications.
Request rate
We provide a request rate metric. It is an average of the access logs request count over 1 minute. It is updated every 30 second.
This can be reached using the Warp 10 class: request_rate.
There are the same labels than for others metrics (see monitoring-metrics)
Access Log data model
Access logs are defined in the 'accessLogs' Warp 10 class and there are three Warp 10 labels available:
owner_id: Organisation IDapp_id: Application ID (ex:app_xxxxxxxx-xxxx-xxxx-xxxx-xxxxxxxxxxx) or Addon ID (ex:postgresql_xxxxxxx-xxxx-xxxx-xxxx-xxxxxxxxxxx)adcorsdcadc(Application Delivery Controller) are used for HTTP connectionssdc(Service Delivery Controller) are used for TCP connections
Available addons for the field
addon_idare mysql, redis, mongodb and postgresql addons.
To reduce space used to store access logs, we defined the following key-value models.
Key-Value model for applications
AccessLogs data models for application. Using HTTP protocol.
t -> timestamp
a -> appId or addonId
o -> ownerId
i -> instanceId
ipS -> ipSource
pS -> portSource # 0 if undefined
s -> source
  lt -> latitude
  lg -> longitude
  ct -> city
  co -> country
ipD -> ipDestination
pD -> portDestination # 0 if undefined
d -> destination
  lt -> latitude
  lg -> longitude
  ct -> city
  co -> country
vb -> verb
path -> path
bIn -> bytesInt
bOut -> bytesOut
h -> hostname
rTime -> responseTime
sTime -> serviceTime
scheme -> scheme
sC -> statusCode
sT -> statusText
tS -> Haproxy termination_state
adc -> Reverse proxy hostname
w -> workerId (Sozu)
r -> requestId (Sozu)
tlsV -> tlsVersion (Sozu)
Key-Value model for addons
AccessLogs data models for addons. Using TCP protocol.
t -> timestamp
a -> appId or addonId
o -> ownerId
i -> instanceId
ipS -> ipSource
pS -> portSource # 0 if undefined
s -> source
  lt -> latitude
  lg -> longitude
  ct -> city
  co -> country
ipD -> ipDestination
pD -> portDestination # 0 if undefined
d -> destination
  lt -> latitude
  lg -> longitude
  ct -> city
  co -> country
tS -> Haproxy termination_state
sdc -> Reverse proxy hostname
sDuration -> total session duration time in millis
Queries examples
The main ways to use accessLogs data is to FETCH over it and get interesting values by a JSON processing.
// Fetch on the 'accessLogs' class for your application id as labels
[ '<READTOKEN>' 'accessLogs' { 'app_id' '<APP_ID>'  } NOW 30 s ] FETCH

// get the path field
<%
    DROP
    VALUES
    <% DROP
        JSON->
        'path' GET
    %> LMAP
%> LMAP
FLATTEN

// distinct|unique results
UNIQUE
A convenient way to integrate the intercepted data in a workflow is to use WarpScript. It is a good idea to use the GTS format to be able to apply all GTS transformation on the output.
In the following example, we get the accessLogs status codes and create a GTS as an output to be able to use FILTER or any other transformation on it a second time.
// Get all application status code  for the last hour
[ '<READTOKEN>' 'accessLogs' { 'app_id' '<APPLICATION ID>' } NOW 10 m ] FETCH
<%
  DROP
  'gts' STORE
  // output new GTS
  NEWGTS
  $gts
  <%
    DUP
    // store the timestamp
    0 GET 'ts' STORE
    // store the status code
    -1 GET JSON-> 'sC' GET 'sC' STORE
    // Keep the same labels in the output GTS than in the input ones
    $gts LABELS RELABEL
    // Add timestamp and status code value to the output GTS
    [ $ts NaN NaN NaN $sC ] ADDVALUE
  %>
  FOREACH
%> LMAP
An example using the provided Clever Cloud macro to straightforward access to the access logs input byte :
'<READ TOKEN>' { 'app_id' 'id' } 'bIn' NOW 1 h @clevercloud/fetch_accessLogs_key_v0or to get the latitude of the destination, which is a nested data:
'<READ TOKEN>' { 'app_id' 'id' } 'd.lt' NOW 1 h @clevercloud/fetch_accessLogs_key_v0Monitoring’ metrics
All applications and VMs instances behind are monitored. Data is sent to Warp 10, a Geotimes series database. All metrics can be processed directly in the console in the Metrics tab of your applications or by the Clever Cloud Warp 10 endpoint.
Monitoring data model
All metrics data follow the same schema in warp 10. Each class represents a specific metric. The context is provided by the Warp 10 labels.
Class values and Labels
Overview
A telegraf daemon supplies most metrics.
Each metric is recorded as a Warp 10 class. Labels provide additional information about the VMs like instances id, organisation id, reverse proxy used.
Labels
In metrics’ data, mains labels would be :
owner_id: A unique ID by organisationapp_id: A unique ID of applicationhost: HV id hosting the VM instanceadc: Reverse proxy ID for http connexion (ie: applications)sdc: Reverse proxy ID for tcp connexion (ie: addons)vm_type:volatileorpersistent. Is it a stateless application or a stateful add-ondeployment_id: ID of the deployment
Classes
Telegraf provide lots of metrics described in their documentation.
Below, the list of all Warp 10 classes representing Telegraf metrics :
| Metric | Metric |
|---|---|
| conntrack.ip_conntrack_count | mem.swap_free |
| conntrack.ip_conntrack_max | mem.swap_total |
| cpu.usage_guest | mem.total |
| cpu.usage_guest_nice | mem.used |
| cpu.usage_idle | mem.used_percent |
| cpu.usage_iowait | mem.vmalloc_chunk |
| cpu.usage_irq | mem.vmalloc_total |
| cpu.usage_nice | mem.vmalloc_used |
| cpu.usage_softirq | mem.wired |
| cpu.usage_steal | mem.write_back |
| cpu.usage_system | mem.write_back_tmp |
| cpu.usage_user | net.bytes_recv |
| disk.free | net.bytes_sent |
| disk.inodes_free | net.drop_in |
| disk.inodes_total | net.drop_out |
| disk.inodes_used | net.err_in |
| disk.total | net.err_out |
| disk.used | net.packets_recv |
| disk.used_percent | net.packets_sent |
| http_response.http_response_code | net_response.response_time |
| http_response.response_time | net_response.result_code |
| http_response.result_code | net_response.result_type |
| http_response.result_type | netstat.tcp_close |
| kernel.boot_time | netstat.tcp_close_wait |
| kernel.context_switches | netstat.tcp_closing |
| kernel.entropy_avail | netstat.tcp_established |
| kernel.interrupts | netstat.tcp_fin_wait1 |
| kernel.processes_forked | netstat.tcp_fin_wait2 |
| mem.active | netstat.tcp_last_ack |
| mem.available | netstat.tcp_listen |
| mem.available_percent | netstat.tcp_none |
| mem.buffered | netstat.tcp_syn_recv |
| mem.cached | netstat.tcp_syn_sent |
| mem.commit_limit | netstat.tcp_time_wait |
| mem.committed_as | netstat.udp_socket |
| mem.dirty | processes.blocked |
| mem.free | processes.dead |
| mem.high_free | processes.idle |
| mem.high_total | processes.paging |
| mem.huge_page_size | processes.running |
| mem.huge_pages_free | processes.sleeping |
| mem.huge_pages_total | processes.stopped |
| mem.inactive | processes.total |
| mem.low_free | processes.total_threads |
| mem.low_total | processes.unknown |
| mem.mapped | processes.zombies |
| mem.page_tables | procstat_lookup.pid_count |
| mem.shared | system.load1 |
| mem.slab | system.load1_per_cpu |
| mem.swap_cached | jvm.statsd-jvm-profiler_heap_ps-old-gen_max.value |
| jvm.statsd-jvm-profiler_pending-finalization-count.value | jvm.statsd-jvm-profiler_nonheap_total_committed.value |
| jvm.statsd-jvm-profiler_loaded-class-count.value | jvm.metrics_jvm_heapMemoryUsage_used.value |
| jvm.statsd-jvm-profiler_gc_PS_Scavenge_count.value | jvm.metrics_jvm_nonHeapMemoryUsage_used.value |
| jvm.statsd-jvm-profiler_nonheap_metaspace_init.value | jvm.statsd-jvm-profiler_nonheap_total_used.value |
| jvm.statsd-jvm-profiler_heap_ps-survivor-space_used.value | jvm.statsd-jvm-profiler_heap_ps-eden-space_init.value |
| jvm.statsd-jvm-profiler_gc_PS_MarkSweep_time.value | jvm.statsd-jvm-profiler_nonheap_total_max.value |
| jvm.statsd-jvm-profiler_heap_ps-eden-space_max.value | jvm.statsd-jvm-profiler_nonheap_compressed-class-space_max.value |
| jvm.statsd-jvm-profiler_heap_total_init.value | jvm.statsd-jvm-profiler_nonheap_code-cache_used.value |
| jvm.statsd-jvm-profiler_nonheap_metaspace_used.value | jvm.statsd-jvm-profiler_nonheap_compressed-class-space_init.value |
| jvm.statsd-jvm-profiler_nonheap_metaspace_max.value | jvm.statsd-jvm-profiler_gc_PS_MarkSweep_count.value |
| jvm.statsd-jvm-profiler_heap_ps-eden-space_used.value |
Examples and usages
From the metrics tab on the console. You can either open a Quantum console, an online WarpScript editor, or either send your WarpScript by your own way on the Warp 10 endpoint (provided by Quantum).
More information about Quantum and Warp 10 in our documentation.
For example, you could fetch the memory usage of an application for the last hour. Smoothed by a data average by minute.
// Fix the NOW timestamp to have the same on over the script
NOW 'NOW' STORE
// fetch data over 1 hour
[ <READ TOKEN> 'mem.available' { 'app_id' '<APPLICATION ID>' } $NOW 1 h ] FETCH
// Average the data by bucket of 1 min from the last point timestamped at NOW
[ SWAP bucketizer.mean $NOW 1 m 0 ] BUCKETIZE
// From the instance granularity to application granularity. Timestamps to timestamps merge
[ SWAP [ 'app_id' ] reducer.mean ] REDUCE
Consumption metric
Consumption can also be inferred by our metrics. We provide some helper macros in the Warp 10 documentation.
Consumption unit is in second.
The following script provides the whole consumption from between start and end timestamps for all applications under an organisation.
'<READ TOKEN>' '<ORGANISATION ID>' <START TIMESTAMP> <END TIMESTAMP> @clevercloud/app_consumptionPublish your own metrics
We currently support two ways to push / collect your metrics: the statsd protocol and prometheus.
The statsd server listens on port 8125. You can send metrics using regular statsd protocol or using an advanced one as described here.
We also support Prometheus metrics collection, by default our agent collects exposed metrics on localhost:9100/metrics.
If needed, you can override those settings with the two following environment variables:
CC_METRICS_PROMETHEUS_PORT: Define the port on which the Prometheus endpoint is availableCC_METRICS_PROMETHEUS_PATH: Define the path on which the Prometheus endpoint is available
As with Prometheus the exposed host can be the same as the application deployed, you can use a basic authentication to collect the metrics with the two following environment variables:
CC_METRICS_PROMETHEUS_USER: Define the user for the basic auth of the Prometheus endpointCC_METRICS_PROMETHEUS_PASSWORD: Define the password for the basic auth of the Prometheus endpoint
For large custom set of metrics to collect, the default response timeout of the /metrics query is 3 seconds. You can update it with the following environment variable:
CC_METRICS_PROMETHEUS_RESPONSE_TIMEOUT: Define the timeout in seconds to collect the application metrics. This value must be below 60 seconds as data are collected every minutes.
To access your metrics from Warp10 you need to use the prefix prometheus. or statsd. based on what you used to publish your metrics.
You can use this query to show all collected metrics:
[
  'TOKEN'
  '~prometheus.*'
  { 'app_id' 'app_xxxxxxxx' }
  NOW 5 m
]
FETCH
Node.js example
You can use node-statsd to publish metrics:
// npm install node-statsd

const StatsD = require("node-statsd"),
  client = new StatsD();

// Increment: Increments a stat by a value (default is 1)
client.increment("my_counter");

// Gauge: Gauge a stat by a specified amount
client.gauge("my_gauge", 123.45);
Haskell example
In Haskell, metrics are usually gathered with EKG.
The package ekg-statsd allows to push EKG metrics over statsd.
If you’re using warp, you can use
wai-middleware-metrics to report request distributions (request count,
responses count aggregated by status code,
responses latency distribution).
EKG allows you to have access to GC metrics, make sure you compile your application
with "-with-rtsopts=-T -N" to enable profiling.
{-# LANGUAGE OverloadedStrings #-}

-- you need the following packages
-- ekg-core
-- ekg-statsd
-- scotty
-- wai-middleware-metrics

import           Control.Monad                   (when)
import           Network.Wai.Metrics             (WaiMetrics, metrics,
                                                  registerWaiMetrics)
import           System.Metrics                  (newStore, registerGcMetrics)
import           System.Remote.Monitoring.Statsd (defaultStatsdOptions,
                                                  forkStatsd)
import           Web.Scotty

handleMetrics :: IO WaiMetrics
handleMetrics = do
  store <- newStore
  registerGcMetrics store
  waiMetrics <- registerWaiMetrics store
  sendMetrics <- maybe False (== "true") <$> lookupEnv "ENABLE_METRICS"
  when sendMetrics $ do
    putStrLn "statsd reporting enabled"
    forkStatsd defaultStatsdOptions store
    return ()
  return waiMetrics

main = do
  waiMetrics <- handleMetrics
  scotty 8080 $ do
     middleware $ metrics waiMetrics
     get "/" $
       html $ "Hello world"