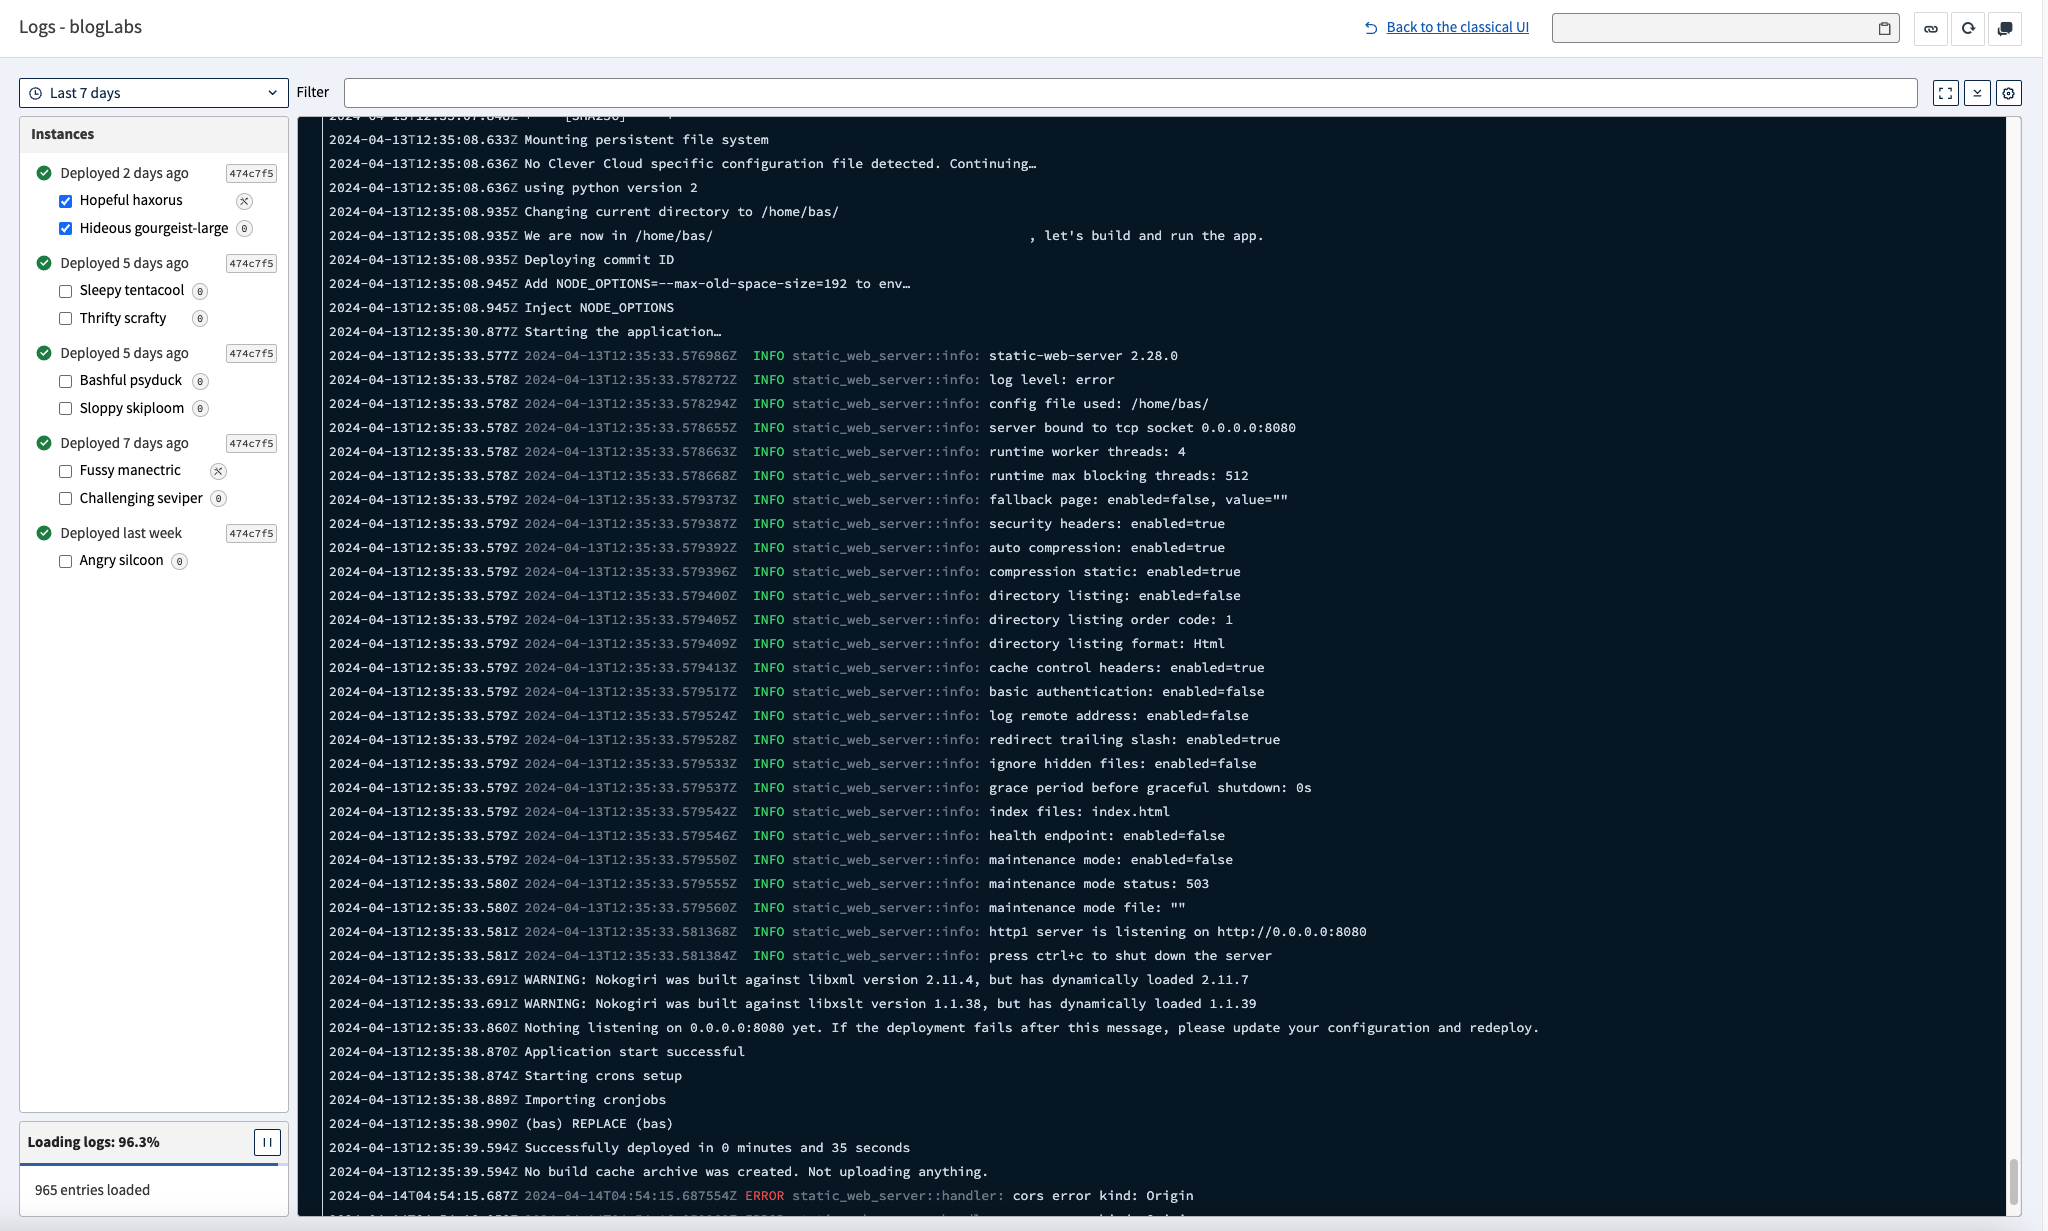
Logs management
Clever Cloud new logs stack is currently in public beta. Activated on-demand in the dedicated section of any application in the Console. It’s not available for add-ons yet. It’s based on Vector and Apache Pulsar. This Web Component allow you to check for live or past logs. You can target a specific time window, select logs lines and copy them in clipboard through keyboard and/or mouse.
There are two text filter modes: exact match (case-sensitive) and regular expression. Settings panel offers lots of parameters such as dark/light themes, line wrapping, ANSI codes escaping, etc. You can also choose the date/time format, UTC or local, to show the instances name or not.

During beta, you can send us your feedback through our GitHub Community:
Get continuous logs from your application
Log management is also available through Clever Tools and our APIv4. They’re collected and sent through the Vector service enabled in every application deployed on Clever Cloud. To disable it, set the CC_PREVENT_LOGSCOLLECTION environment variable to true. You can see logs with the command down below.
clever logsYou can add --since, followed by a duration or a date (ISO8601 format). The --until flag should be followed by a date (ISO8601 format).
clever logs --since 2h
clever logs --until 2024-04-15T13:37:42Z
You can also get your add-on’s logs by using --addon flag, the value must be the add-on ID starting by addon_.
clever logs --addon <addon_xxx>clever logs.Access logs
It contains all incoming requests to your application. Here is an example:
255.255.255.255 - - [06/Feb/2020:07:59:22 +0100] "GET /aget/to/your/beautiful/website -" 200 1453They are available in different formats, the most common is CLF which stands for Common Log Format.
You can see access logs with the following command:
clever accesslogsAs with the logs command, you can specify --before and --after flags.
If you don’t specify any options, the logs display continuously.
To change the output, specify the --format flag with one of these values:
simple:
2021-06-25T10:11:35.358Z 255.255.255.255 GET /extended:
2021-06-25T10:11:35.358Z [ 255.255.255.255 - Nantes, FR ] GET www.clever-cloud.com / 200clf:
255.255.255.255 - - [25/Jun/2021:12:11:35 +0200] "GET / -" 200 562json:
  {
      "t":"2021-06-25T10:11:35.358209Z",
      "a":"app_xxxxxxxx-xxxx-xxxx-xxxx-xxxxxxxxxxxx",
      "adc":"clevercloud-adc-nX",
      "o":"orga_xxxxxxxx-xxxx-xxxx-xxxx-xxxxxxxxxxxx",
      "i":"xxxxxxxx-xxxx-xxxx-xxxx-xxxxxxxxxxxx",
      "ipS":"255.255.255.255",
      "pS":58477,
      "s":{
          "lt":50.624,
          "lg":3.0511,
          "ct":"Nantes",
          "co":"FR"
      },
      "ipD":"46.252.181.17",
      "pD":14001,
      "d":{
          "lt":45.7059,
          "lg":4.7444,
          "ct":"Chaponost",
          "co":"FR"
      },
      "vb":"GET",
      "path":"/",
      "bIn":658,"bOut":562,
      "h":"www.clever-cloud.com",
      "rTime":"31ms",
      "sTime":"75μs",
      "scheme":"HTTPS",
      "sC":200,"sT":"OK",
      "w":"WRK-01",
      "r":"01F91AEG8Z9RJKYB7JY7H56FNB",
      "tlsV":"TLS1.3"
  }
Exporting logs to an external tool
You can use the logs drains to send your application’s logs to an external server with the following command.
clever drain create [--alias <alias>] <DRAIN-TYPE> <DRAIN-URL> [--username <username>] [--password <password>]Where DRAIN-TYPE is one of:
TCPSyslog: for TCP syslog endpoint;UDPSyslog: for UDP syslog endpoint;HTTP: for TCP syslog endpoint (note that this endpoint has optional username/password parameters as HTTP Basic Authentication);ElasticSearch: for Elasticsearch endpoint (note that this endpoint requires username/password parameters as HTTP Basic Authentication);DatadogHTTP: for Datadog endpoint (note that this endpoint needs your Datadog API Key).
You can list the currently activated drains with this command.
clever drain [--alias <alias>]And remove them if needed
clever drain remove [--alias <alias>] <DRAIN-ID>If the status of your drain appears as DISABLED without you disabling it, it may be because it haven’t been able to send your application logs to your drain endpoint or because the requests timed out after 25 seconds.
Use the logs drain to send your add-on’s logs by using --addon flag, the value must be the add-on ID starting by addon_.
Elasticsearch
ElasticSearch drains use the Elastic bulk API. To match this endpoint, specify /_bulk at the end of your Elasticsearch endpoint.
clever drain create ElasticSearch https://xxx-elasticsearch.services.clever-cloud.com/_bulk --username USERNAME --password PASSWORDEach day, we will create an index logstash-<yyyy-MM-dd> and push logs to it.
Index Lifecycle Management
Depending on the amount of logs generated by your application, you might want to manage the lifecycle of your log indexes to prevent your Elasticsearch instance from running out of storage space.
To do so, Elasticsearch provides a feature called Index Lifecycle management that allows you to create a policy to delete indexes based on their creation date.
With our Elasticsearch add-on, you can choose to create a Kibana application in which you can create the policy and apply it to your indexes with an index template, but you can create them manually through API requests.
Here is an example that will create a policy to delete indexes older than 30 days:
curl -X PUT "https://username:password@xxx-elasticsearch.services.clever-cloud.com/_ilm/policy/logs_drain?pretty" -H 'Content-Type: application/json' -d'
{
  "policy": {
    "phases": {
      "delete": {
        "min_age": "30d",
        "actions": {
          "delete": {}
        }
      }
    }
  }
}
'
An index template example to apply the policy based on an index pattern:
curl -X PUT "https://username:password@xxx-elasticsearch.services.clever-cloud.com/_index_template/logs_drain?pretty" -H 'Content-Type: application/json' -d'
{
  "index_patterns": ["logstash-*"],
  "template": {
    "settings": {
      "index.lifecycle.name": "logs_drain"
    }
  }
}
'
For more information, please refer to the official documentation.
Datadog
To create a Datadog drain, you just need to use:
clever drain create DatadogHTTP "https://http-intake.logs.datadoghq.com/v1/input/<API_KEY>?ddsource=clevercloud&service=<SERVICE>&hostname=<HOST>"datadoghq.eu or datadoghq.com).NewRelic
To create a NewRelic drain, use:
clever drain create NewRelicHTTP "https://log-api.eu.newrelic.com/log/v1" --api-key "<API_KEY>"log-api.eu.newrelic.com or log-api.newrelic.com).OVHcloud Logs Data Platform
To export logs from an application or an add-on to OVHcloud Logs Data Platform, use the following setup:
- A TCP drain log with
clever drain create TCPSyslog - Your Logs Data Platform host with port
514(SSL ports aren’t supported for TCP drains) - The write token for your stream (provided on your Logs Data Platform console)
On your terminal, use the following command:
Exporting logs from an application:
clever drain create TCPSyslog tcp://<host>:514 -app <application-id-or-name> --sd-params="X-OVH-TOKEN=\"<token>\""Replace the following values:
<host><application-alias><token>
Exporting logs from an add-on:
clever drain create TCPSyslog tcp://<host>:514 -addon <addon_id> --sd-params="X-OVH-TOKEN=\"<token>\""Replace the following values:
<host><addon_id><token>
Community software
HTTPS-based solution
Some tools available on GitHub enable to create a drain to collect logs through an HTTPS endpoint. This project, for example, is fully compatible with Clever Cloud.
You could host it as an app and an add-on on Clever Cloud. A complete README explains all the features.
Did this documentation help you ?